Data is beautiful.
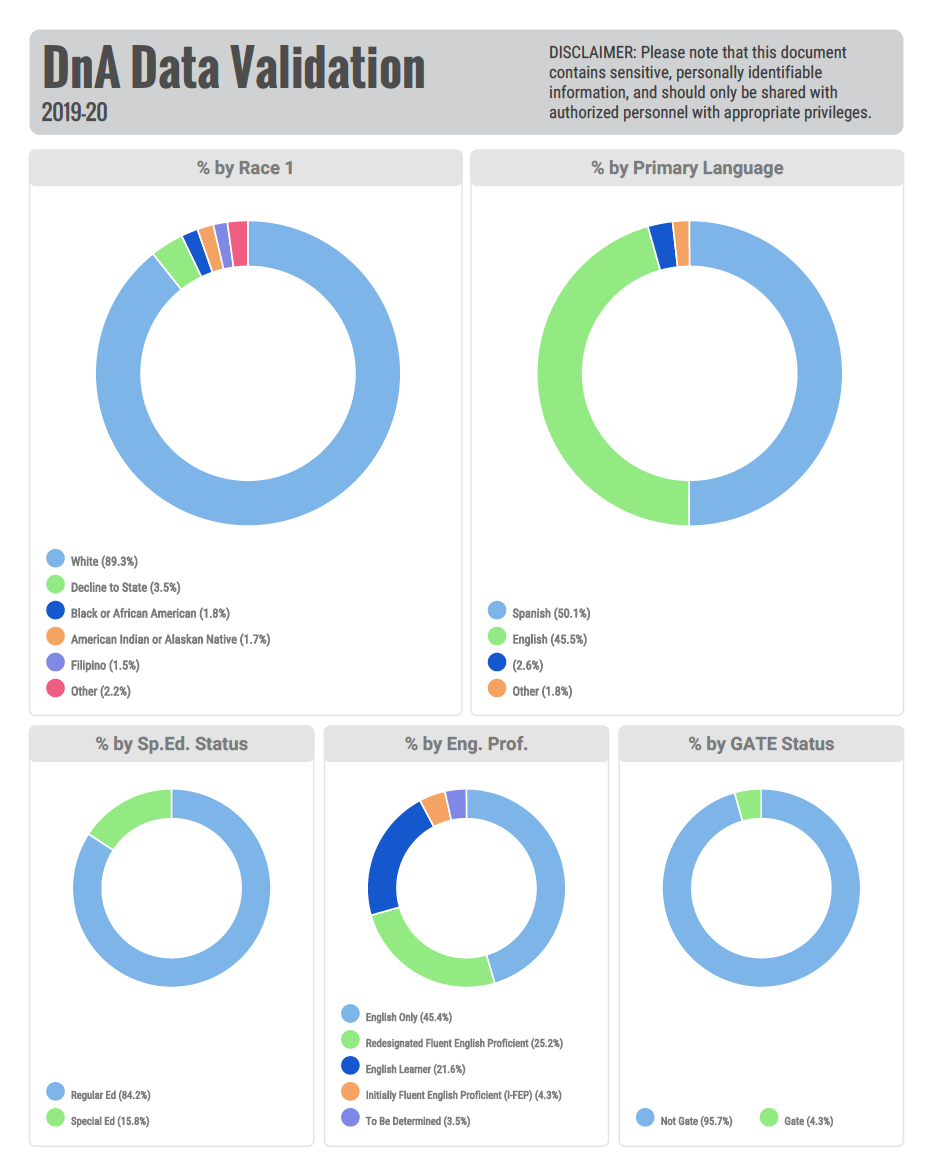
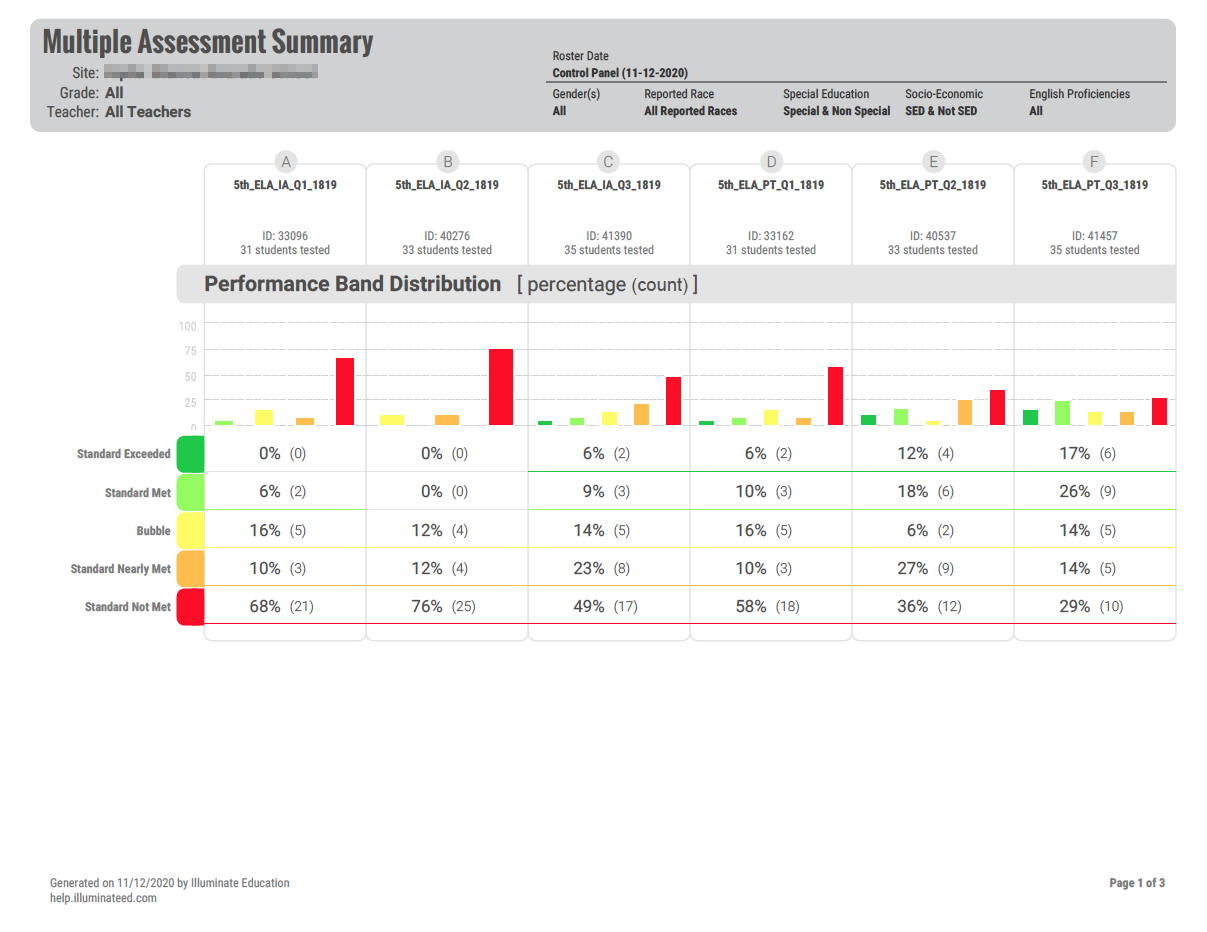
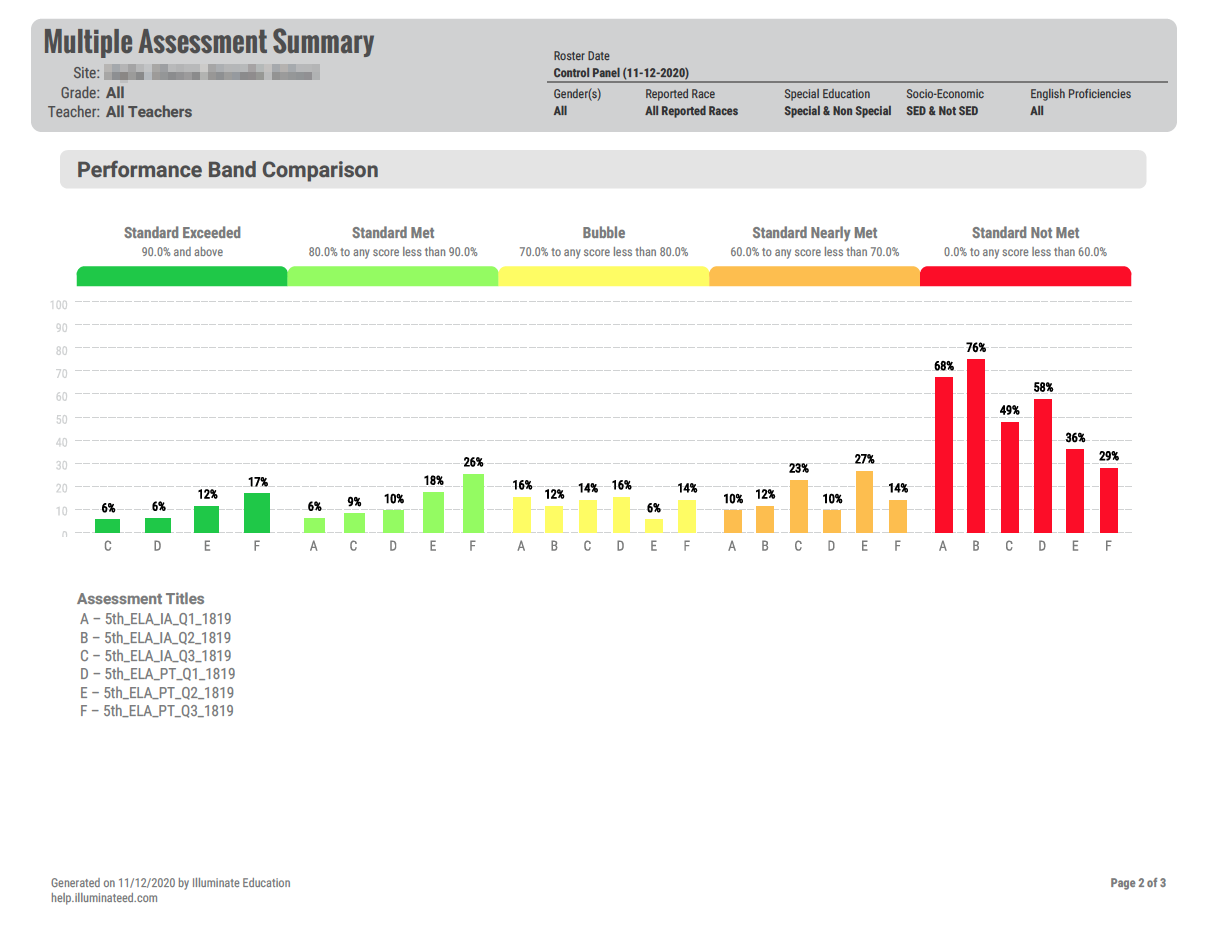
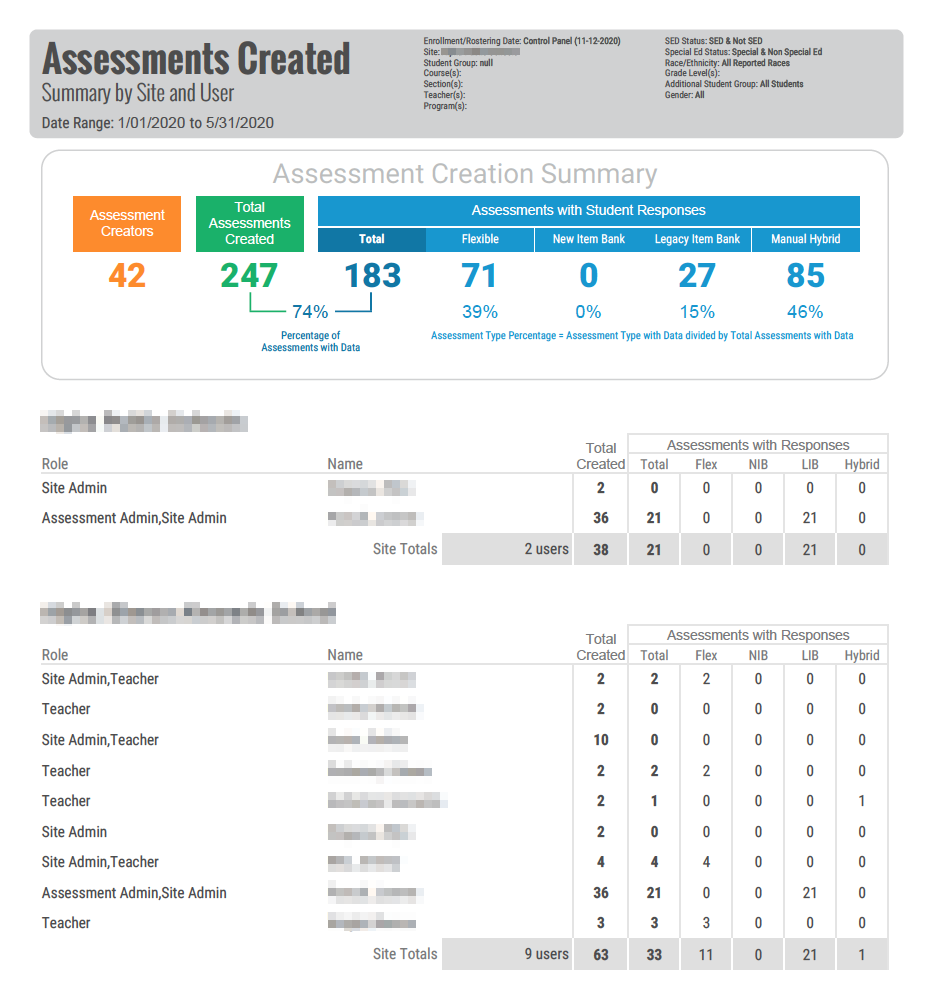
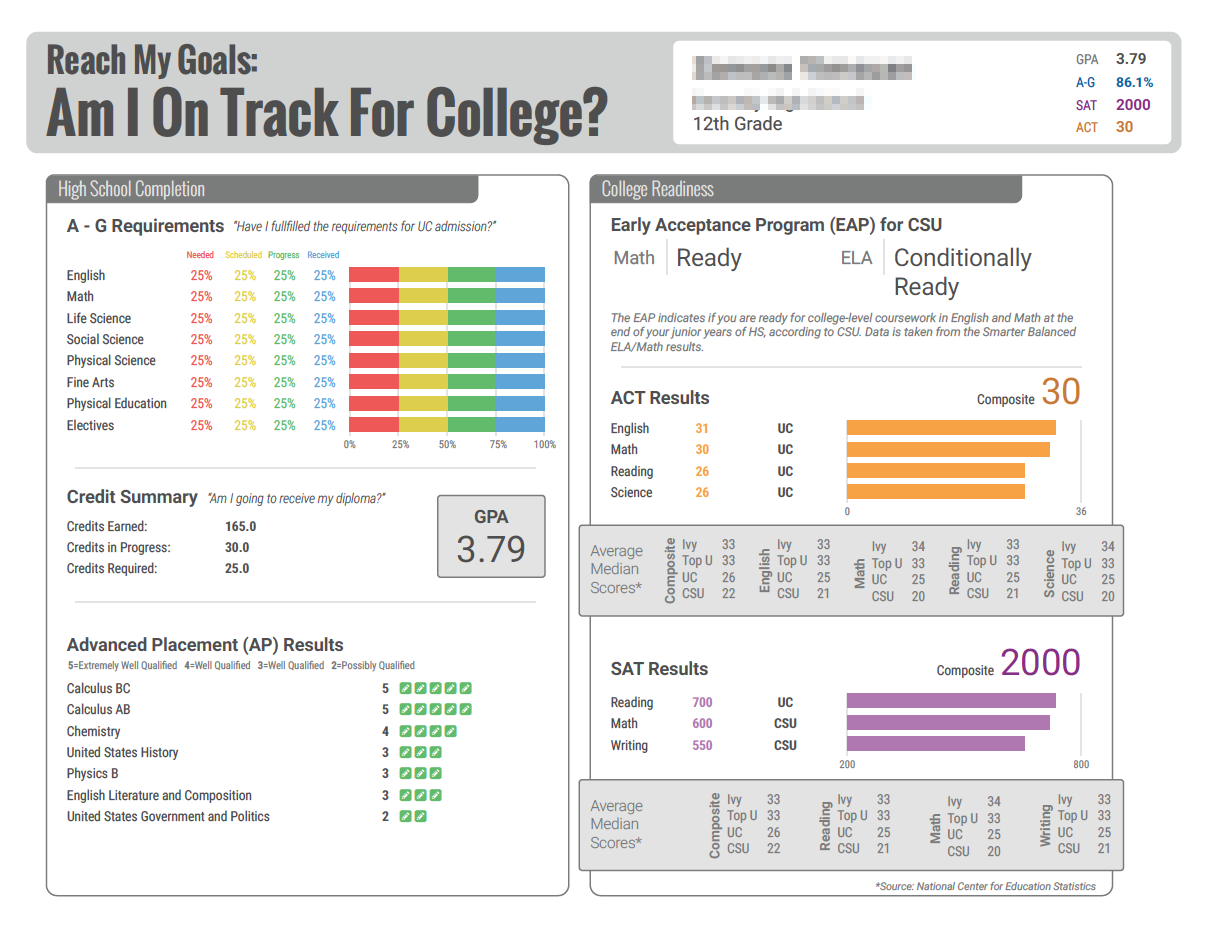
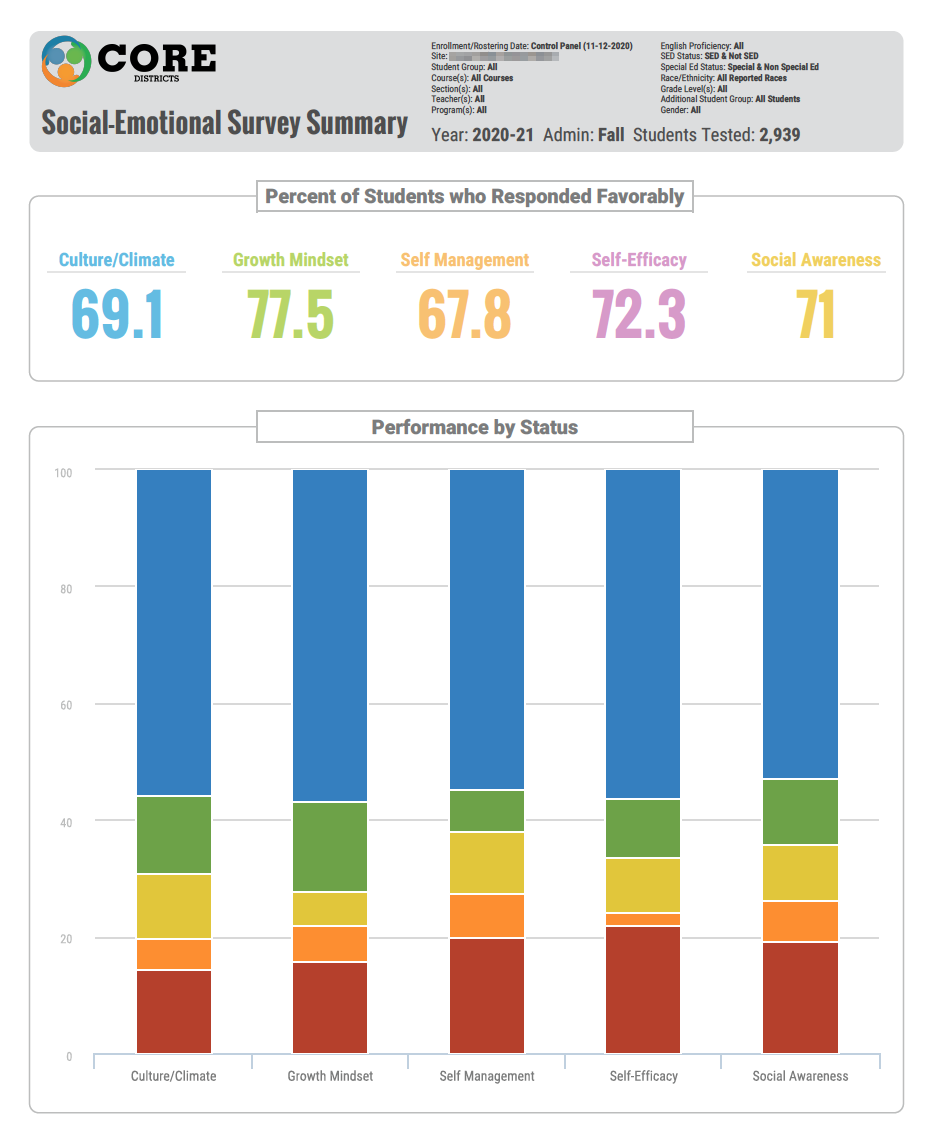
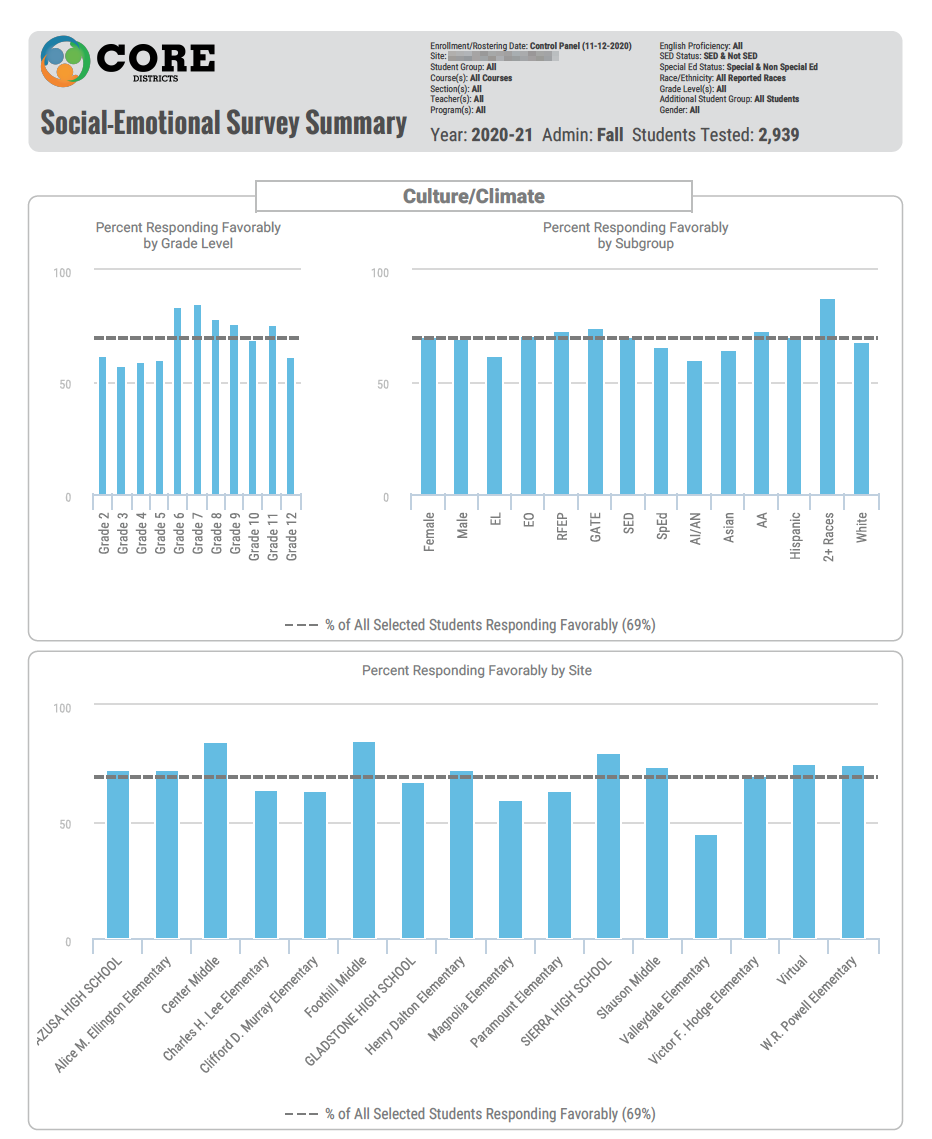
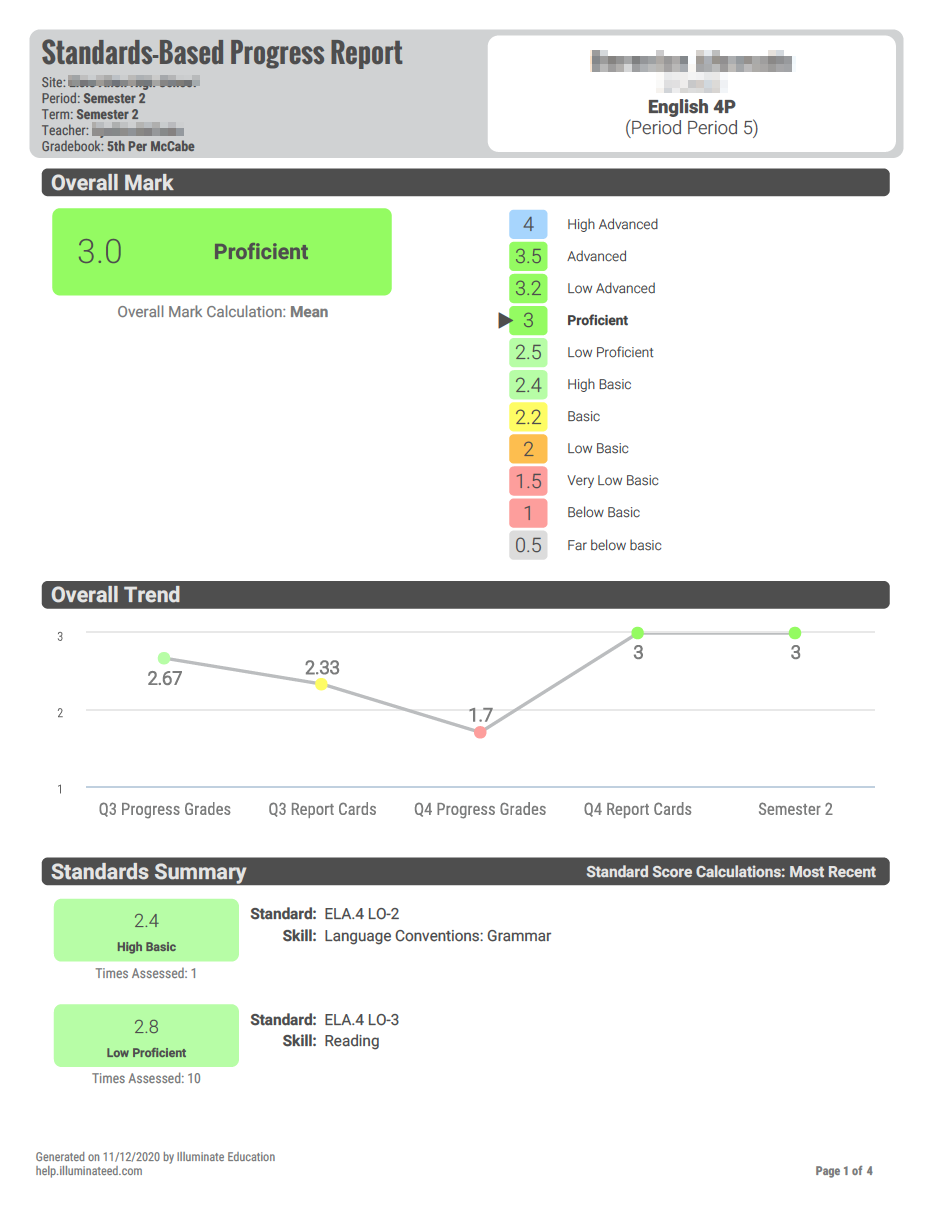
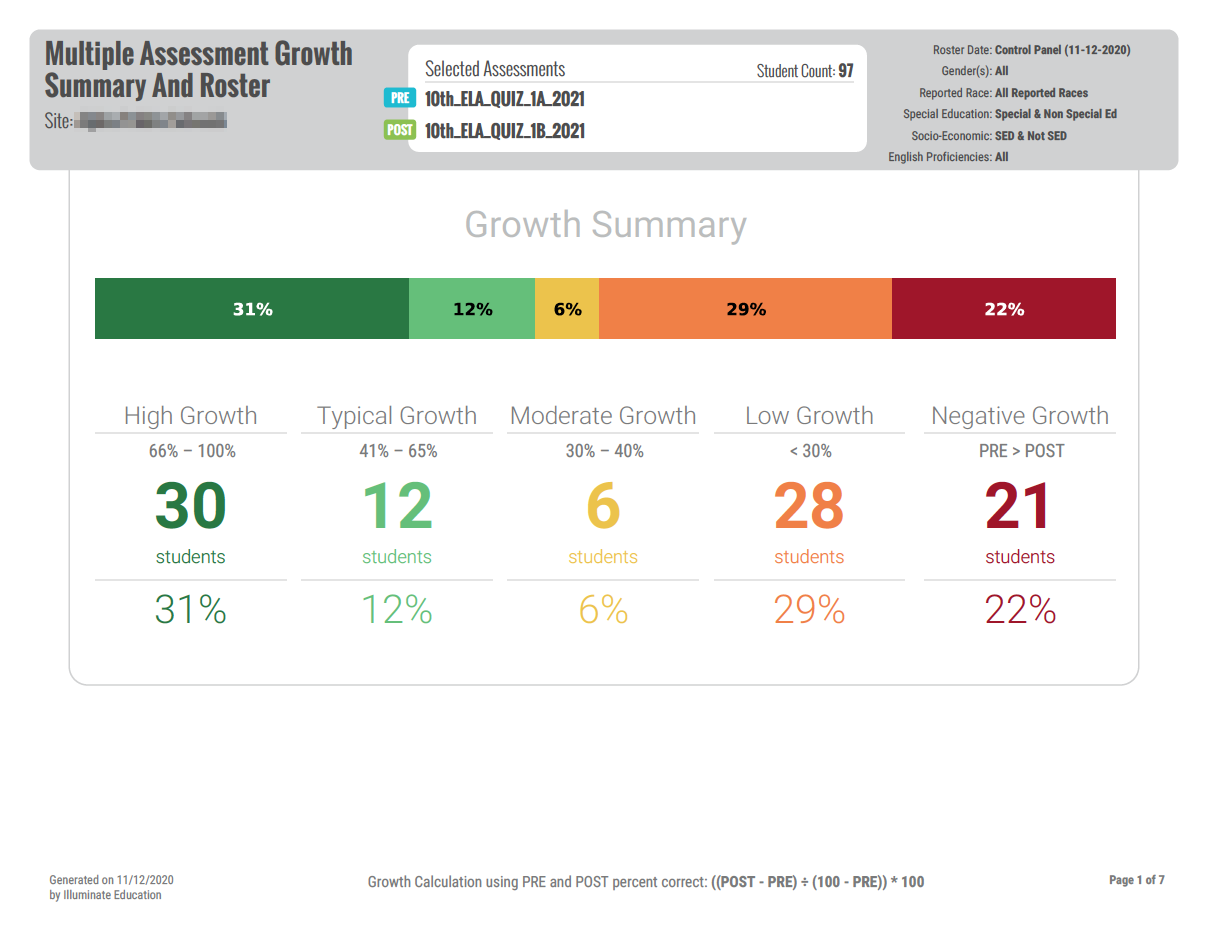
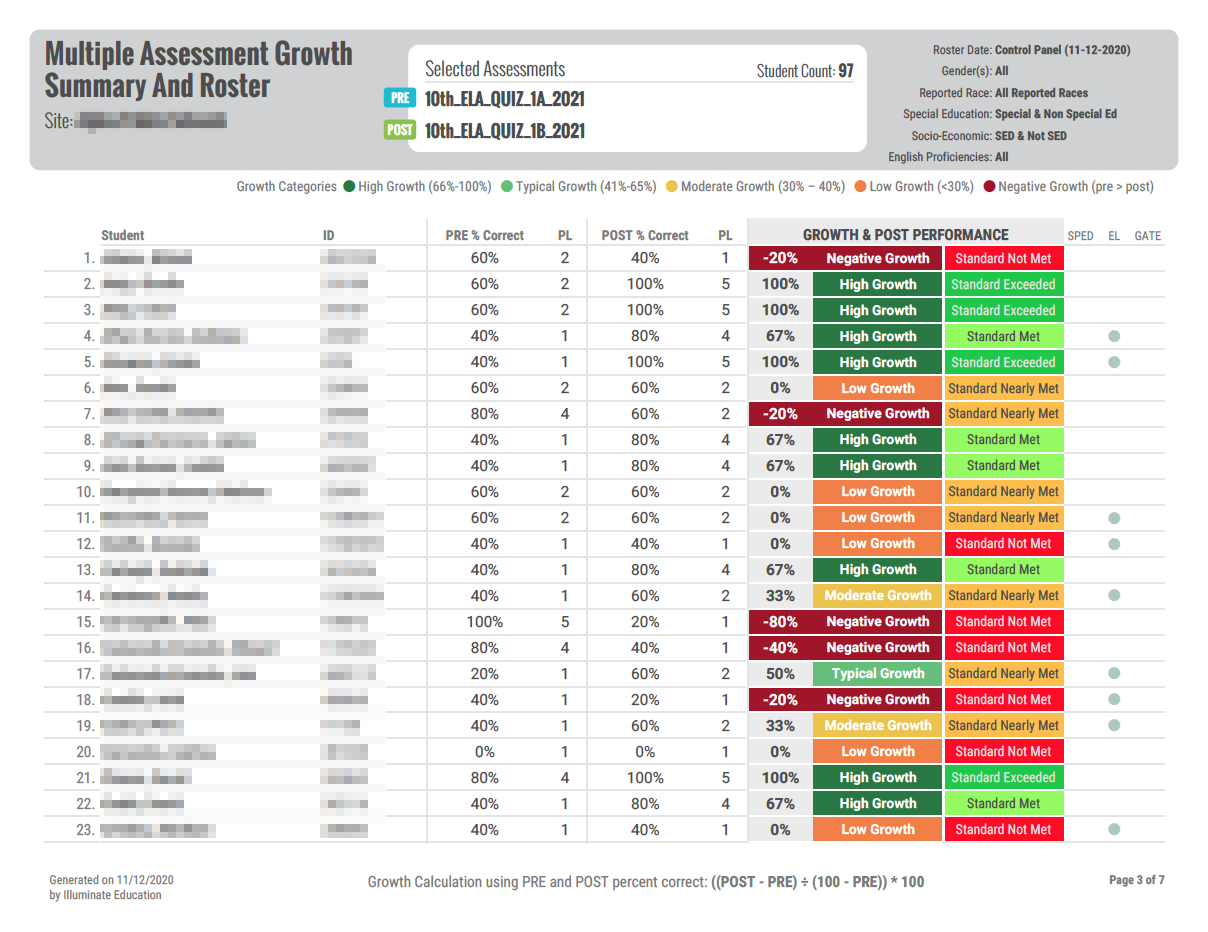
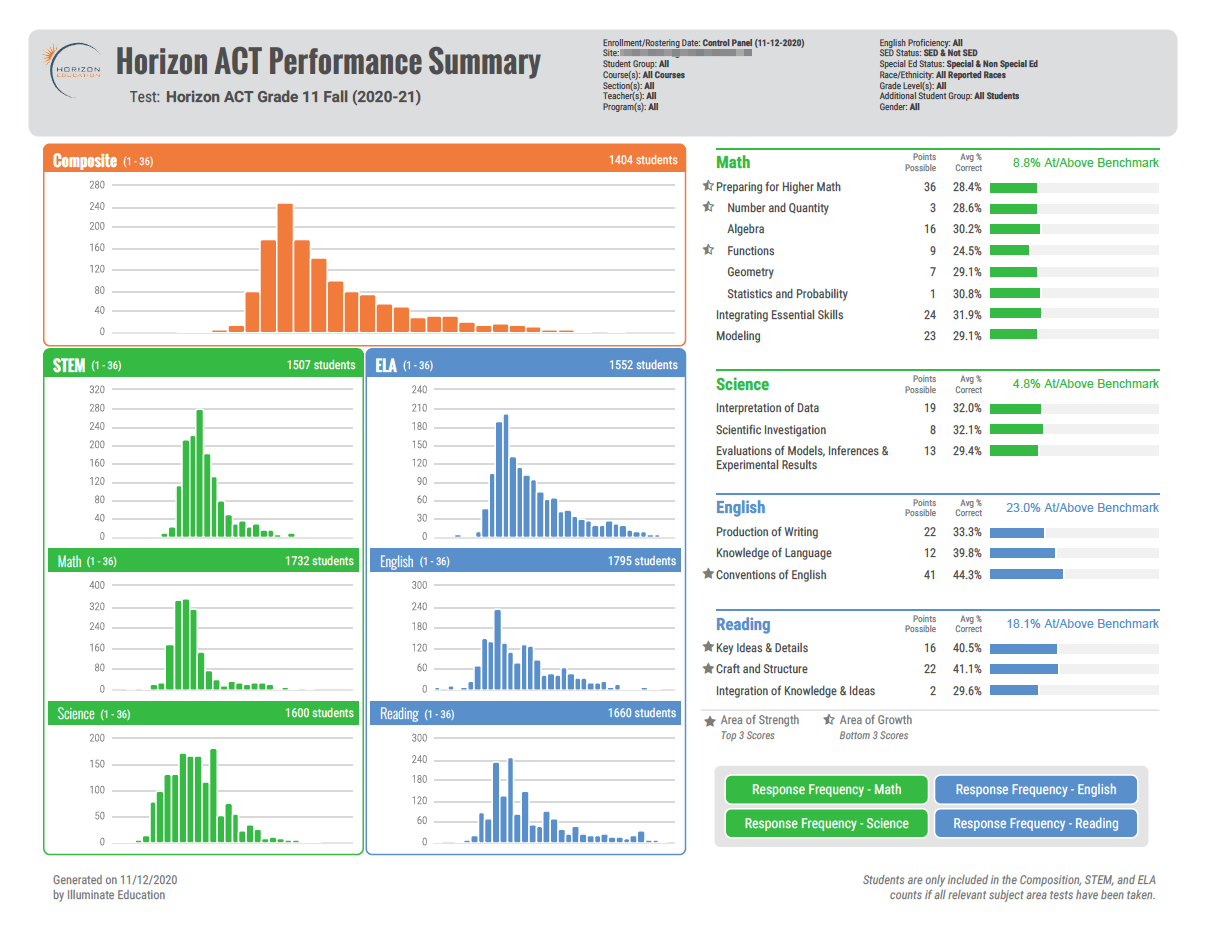
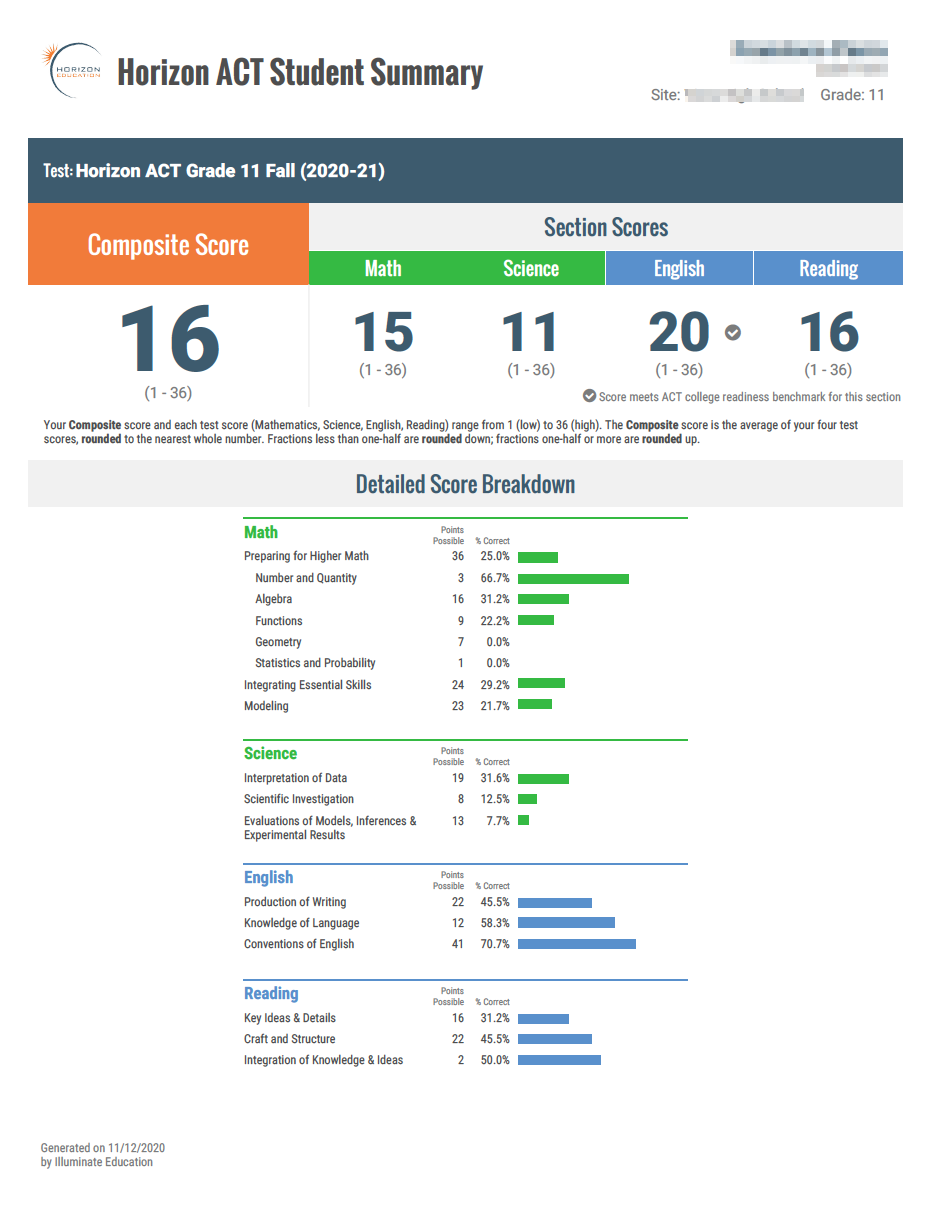
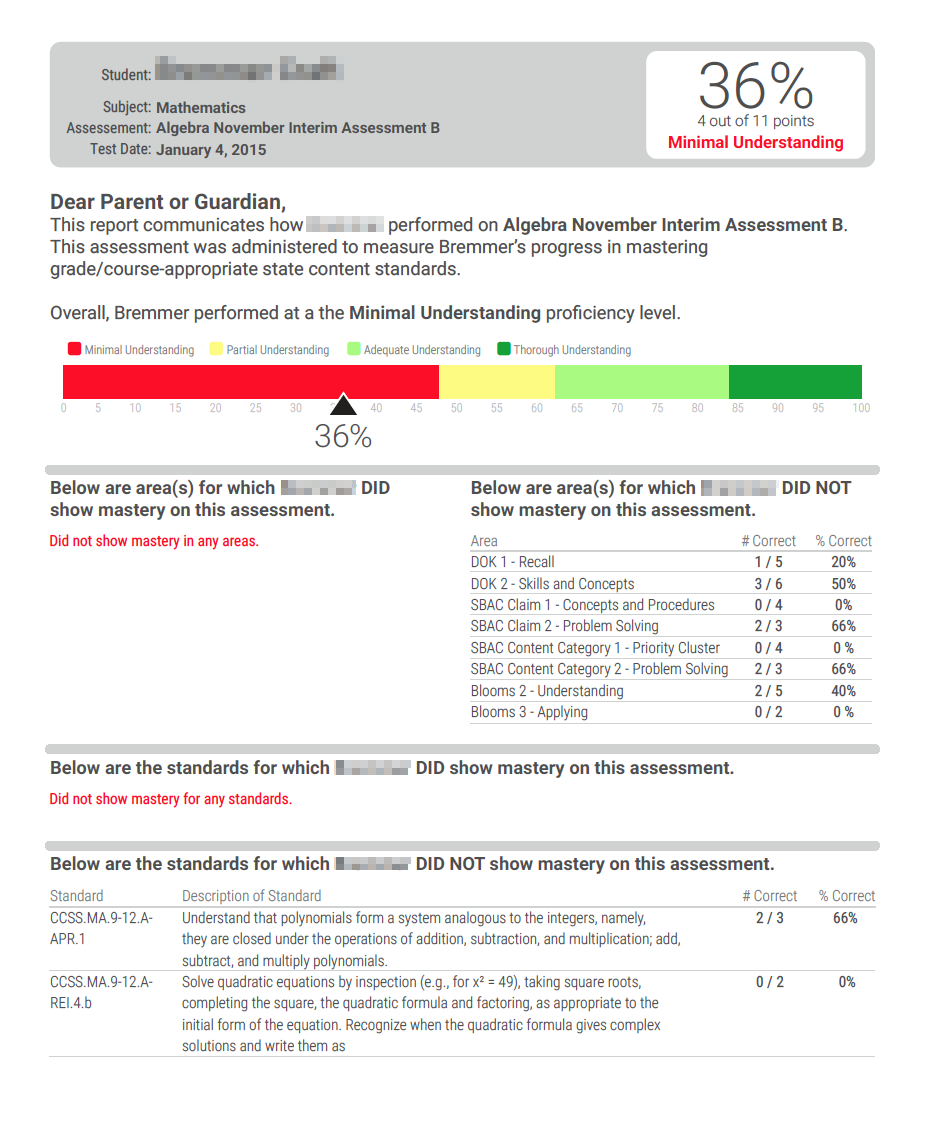
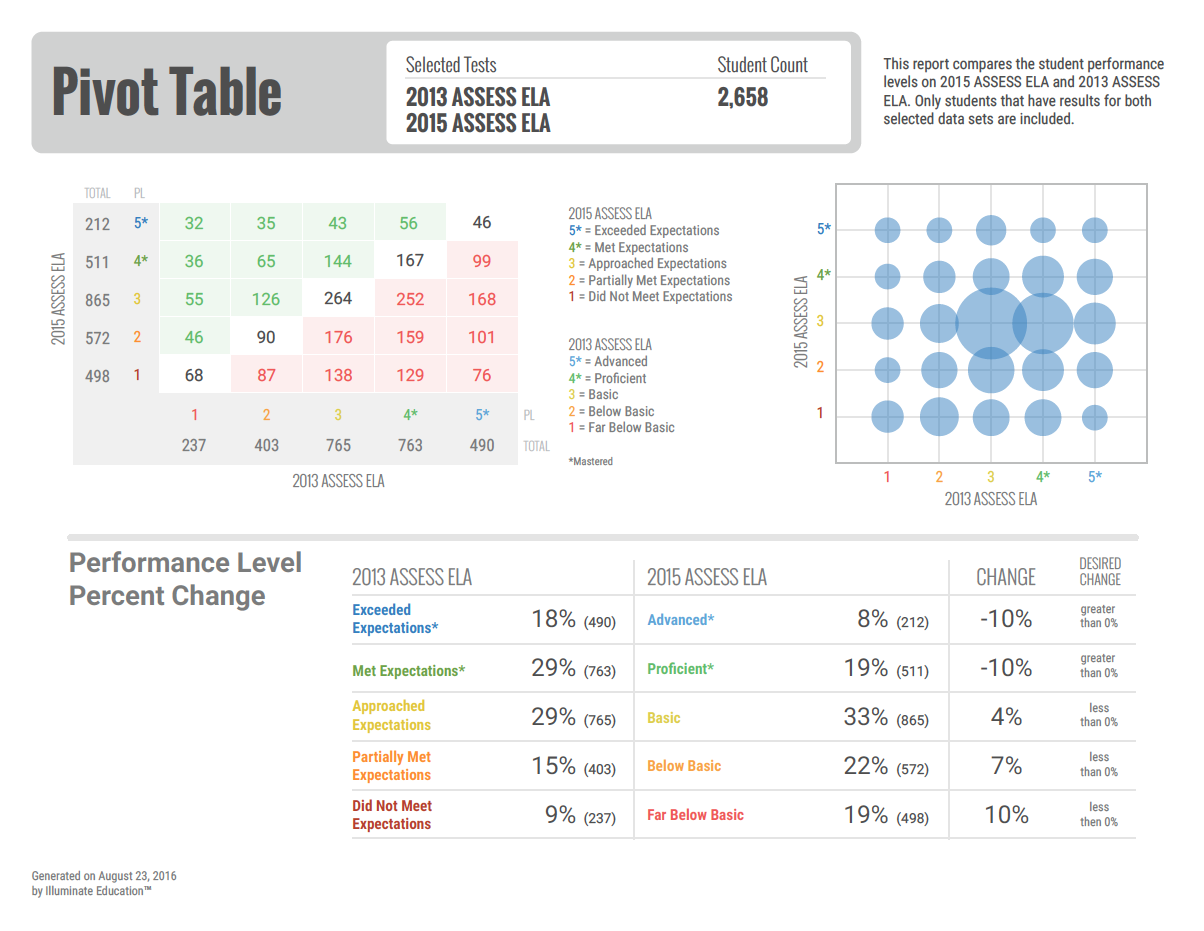
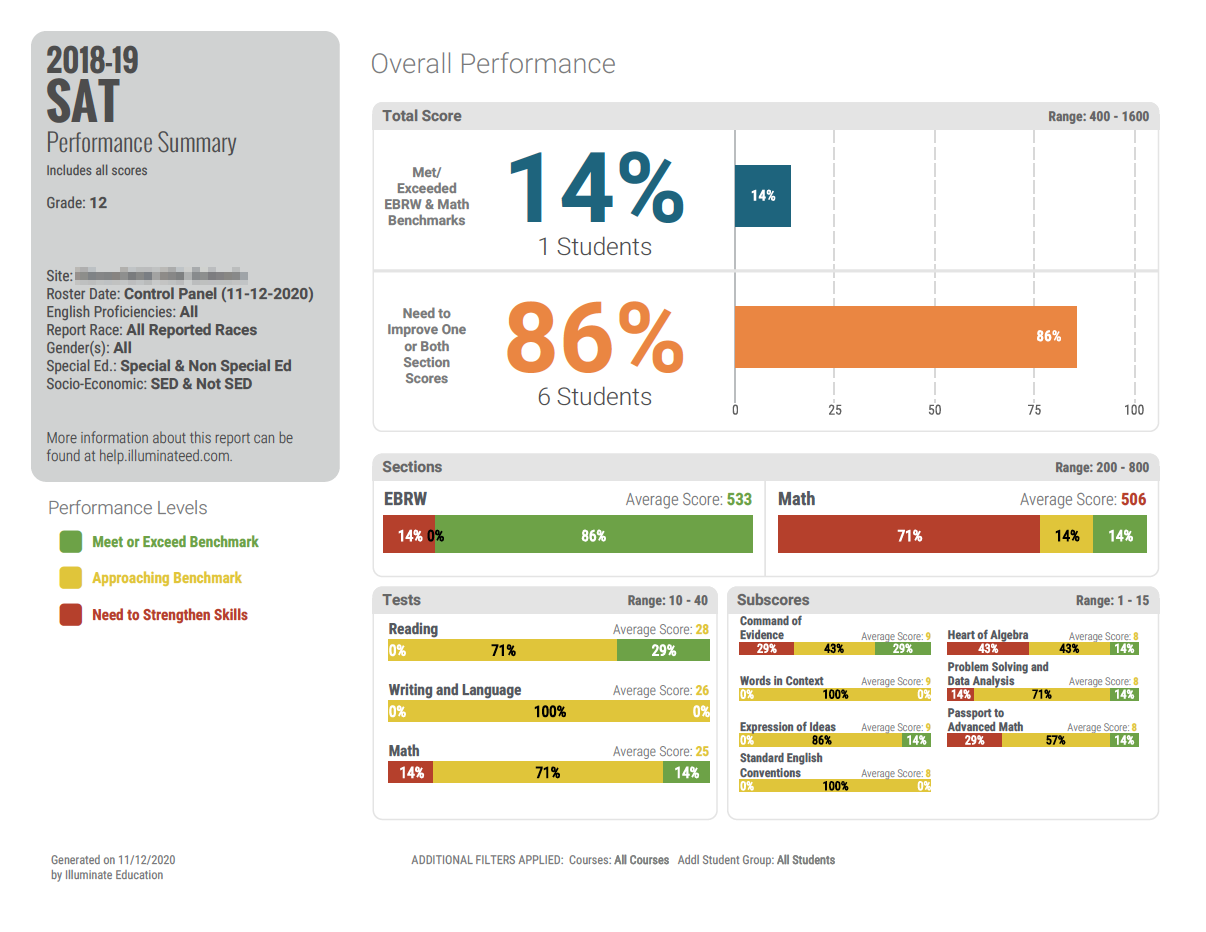
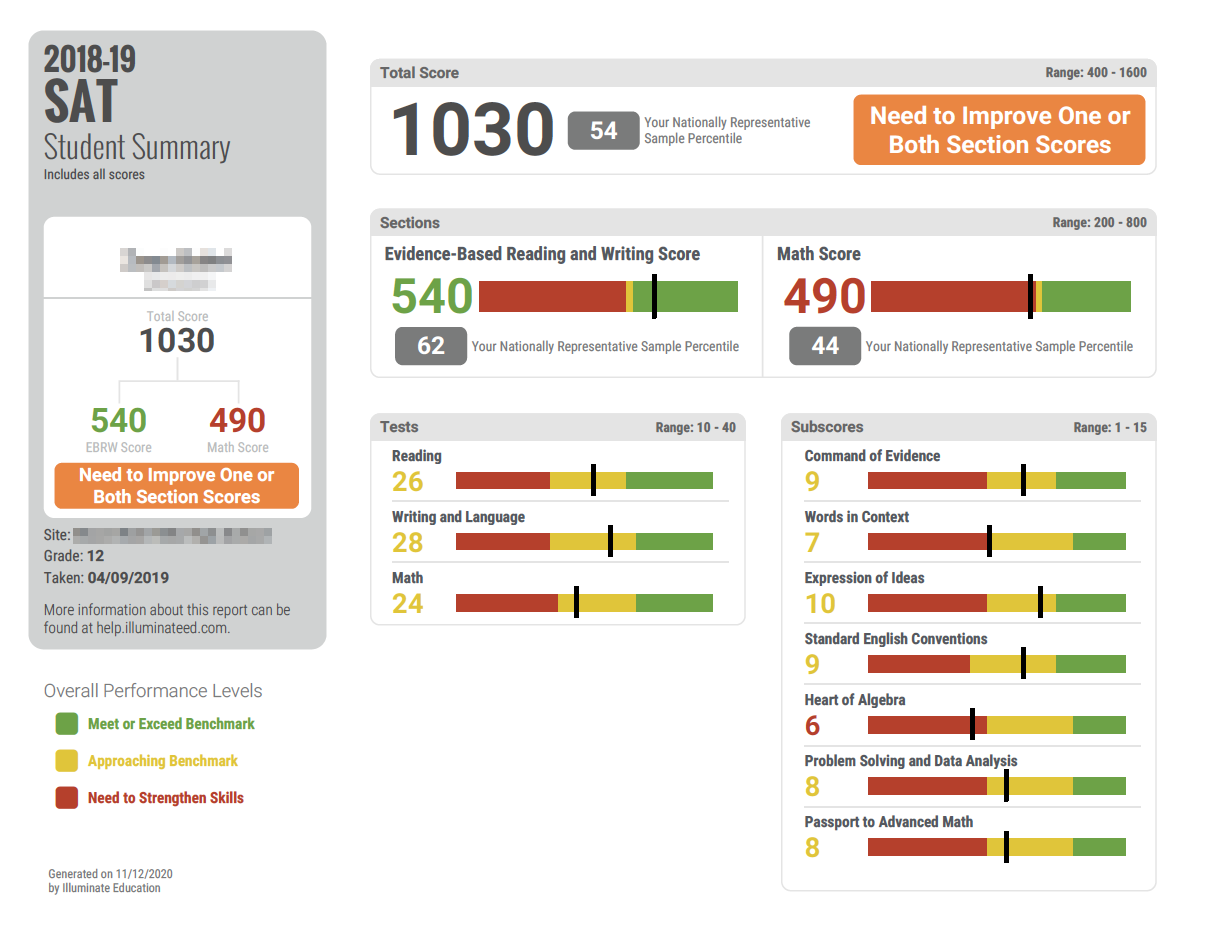
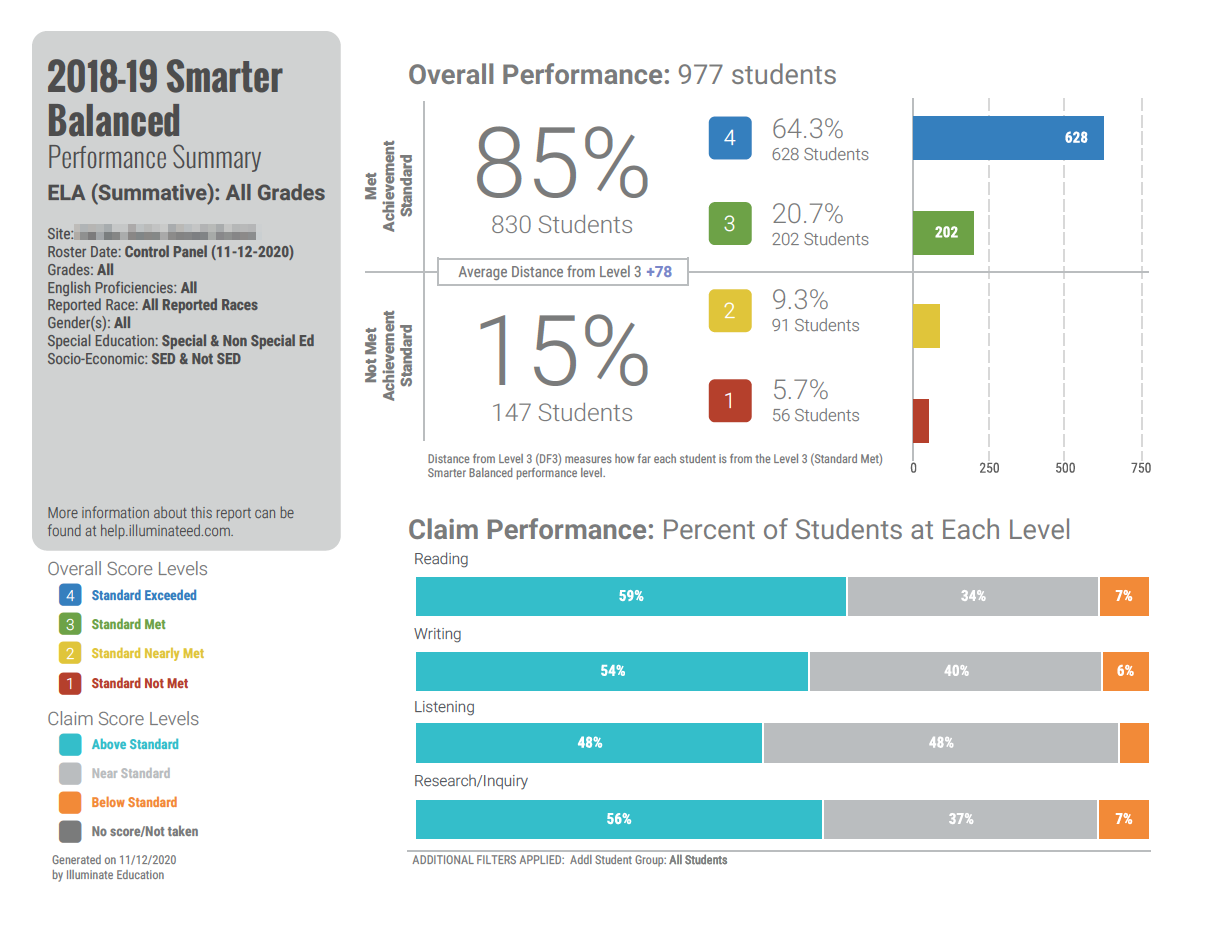
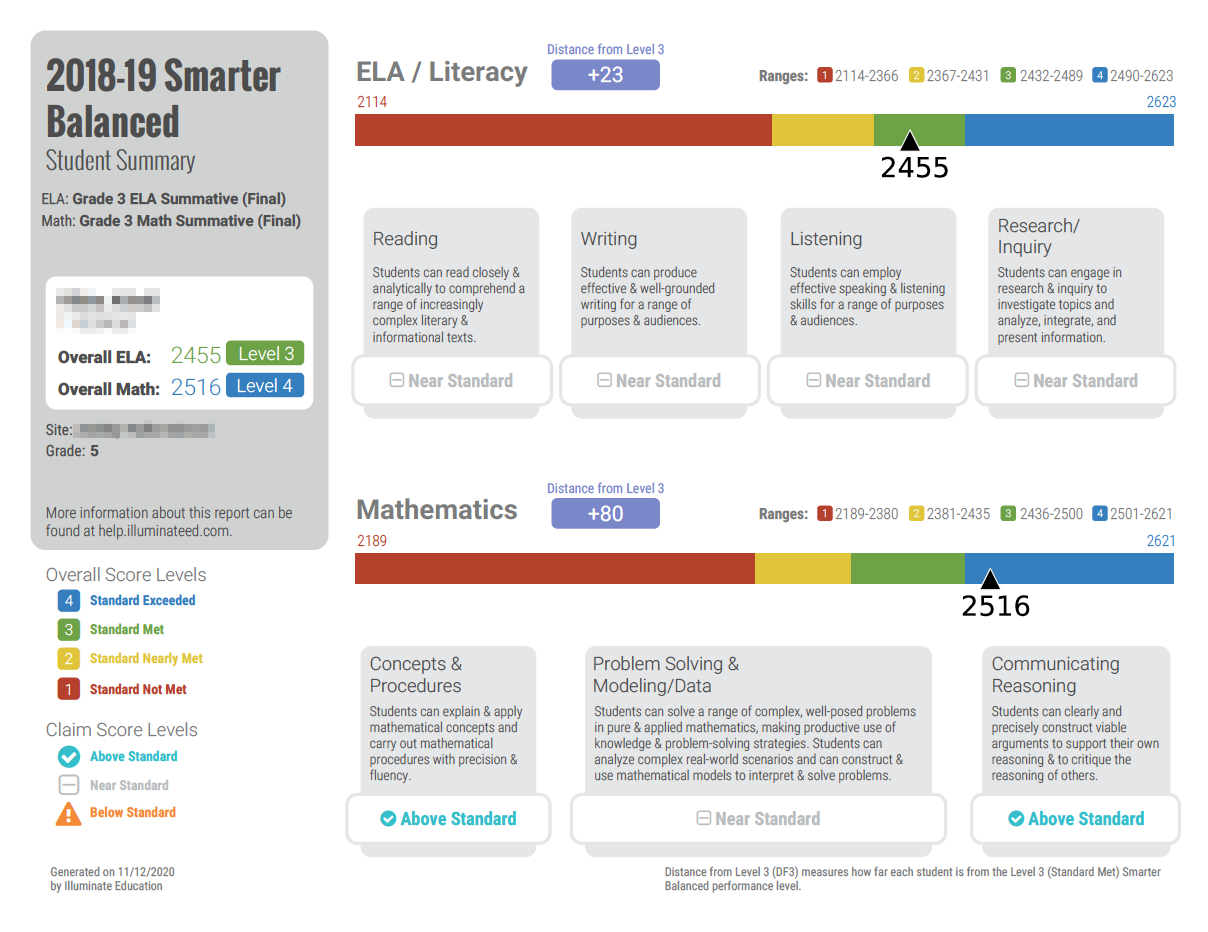
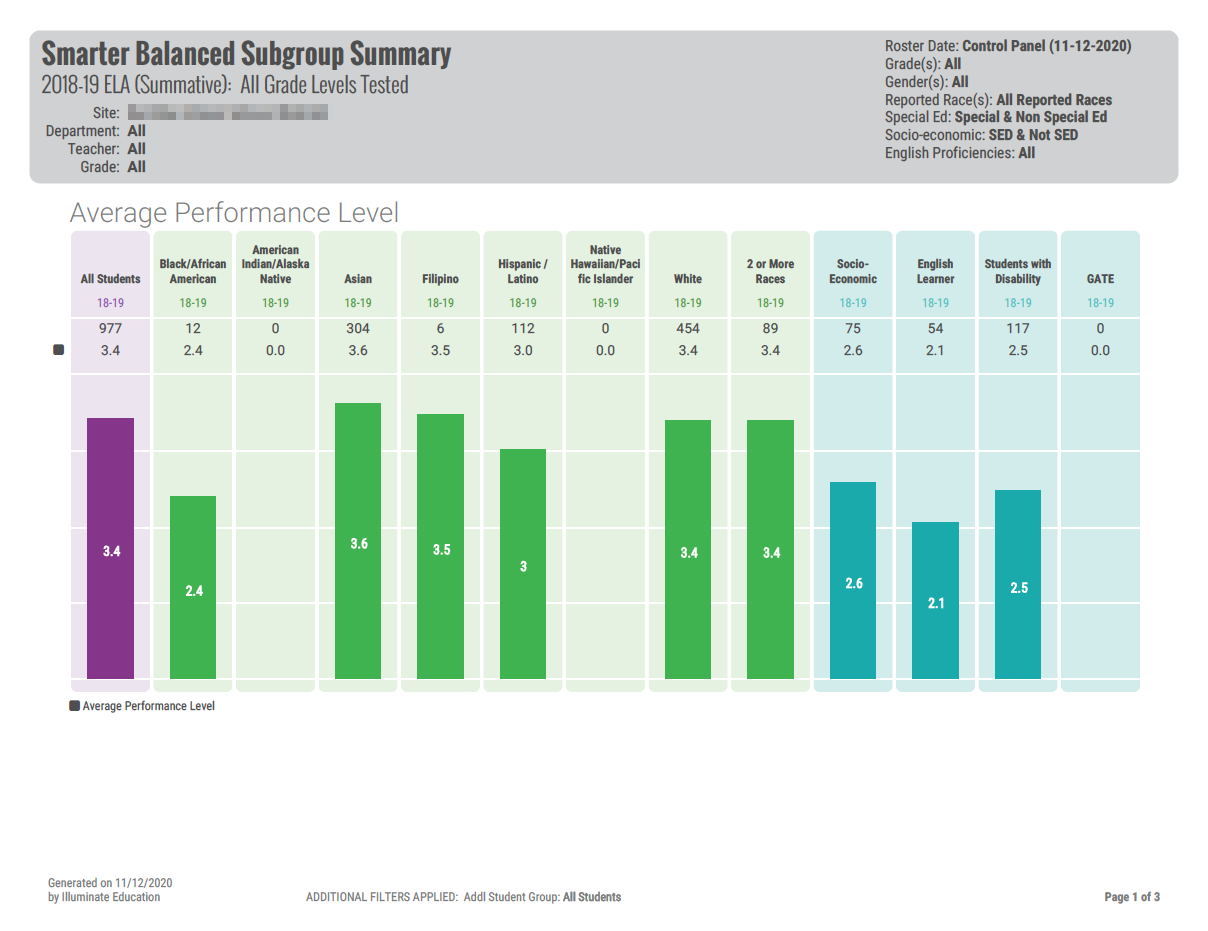
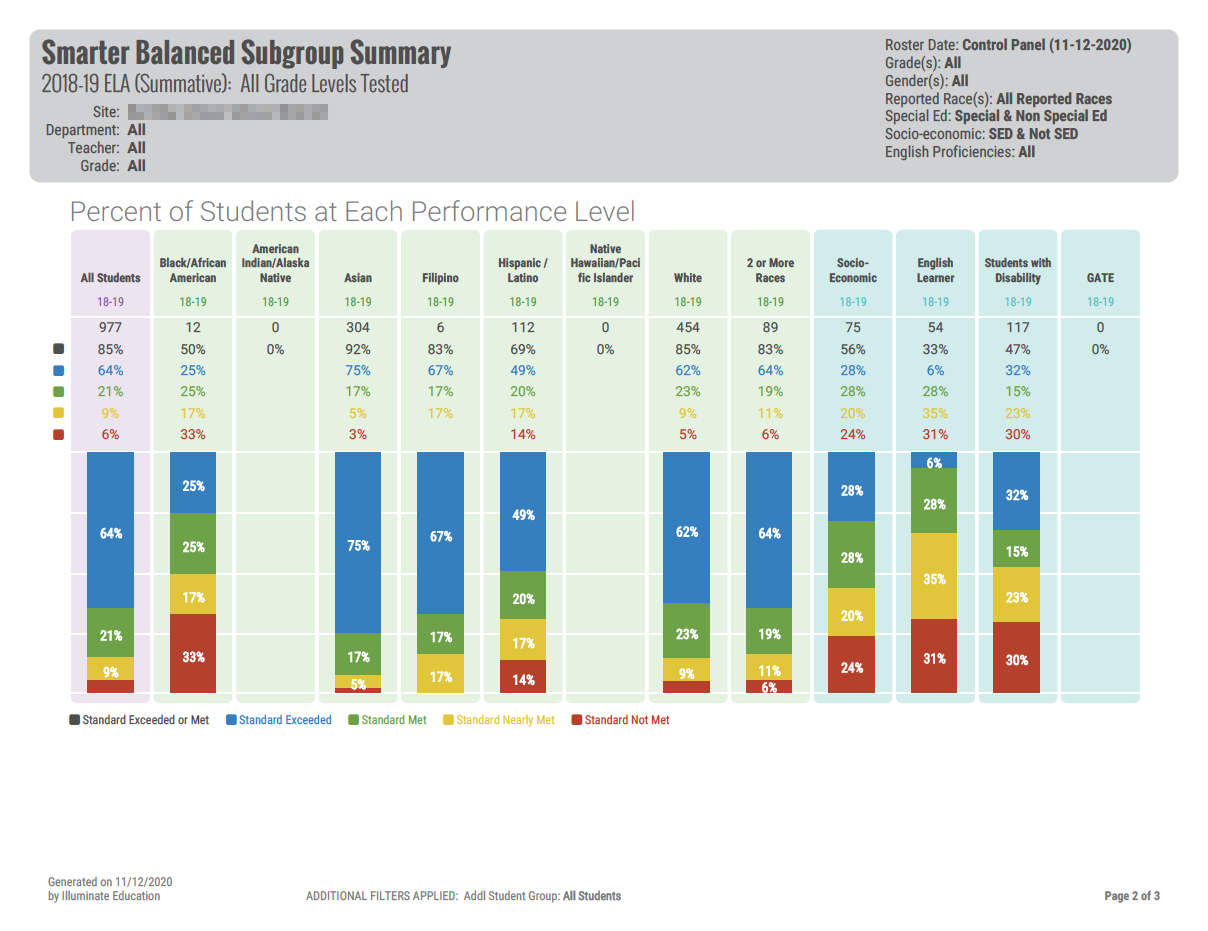
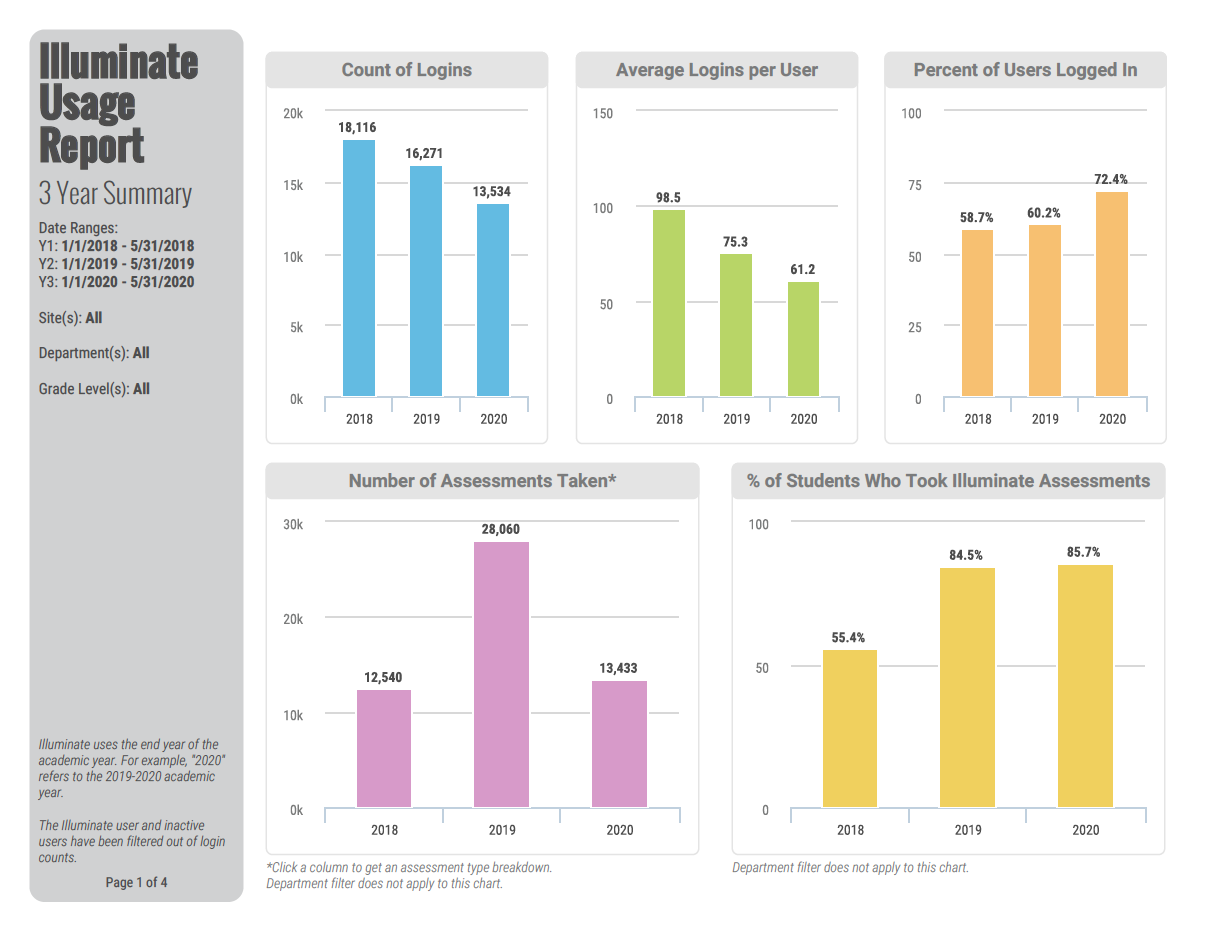
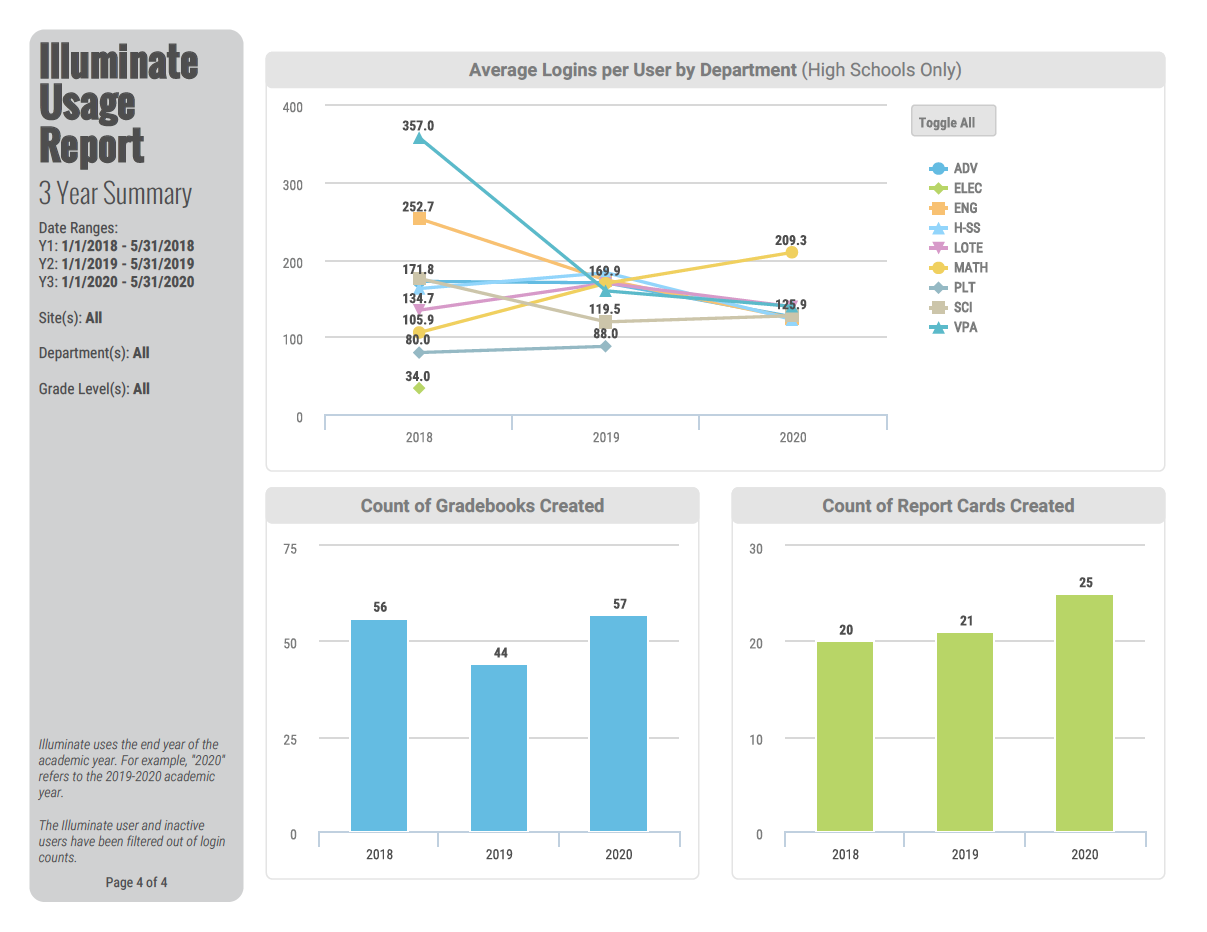
Data visualizations and well-designed reports make big and small data easier for the human brain to understand. Visualizations also make it easier to detect patterns, trends, and outliers in groups of data. Good data visualizations should place meaning into complicated datasets so that their message is clear and concise.
Tools: TIBCO Jaspersoft, SQL, PHP, JavaScript